Moving Average Bounce Trading System
Oct 13, 2023 By Triston Martin
Sometimes when shopping, you’d like to go with a picture of what you want and how much it costs. The best strategy is to average the prices of the highest price the item has been sold at with the least. This will at least give you an estimation of how much you are likely to spend.
In the stock market, traders also average between the highs and lows of stock prices. Here’s the catch: this average price is constantly updated, hence the term ‘moving.’ The timeframe required is relative, depending on the trader’s needs and preferences. It could be days, weeks or even minutes.

A moving average evens out the stock’s price by ignoring short-term issues that may cause price fluctuations. The thinking is that these factors will not affect the stock’s long-term price and are irrelevant for all intents and purposes.
Moving averages are said to be lagging indicators because they deal with historical data. Hence, traders may not prefer them to other tools. They will mostly lag behind price/volume charts which are real-time.
Calculation of Moving Average Indicators
Moving averages are calculated by averaging equal subsets and moving forward by one data set consequently after each calculation. This gives it the name moving average, sometimes called running average or rolling average. It depicts a shift in averages.
A simple example like the one below will suffice to explain:
Assuming that the series is (98, 95, 93, 78, 30, 101, 94, 90, 89, 121). The average for this would be (98 + 95 + 93 + 78 + 30) then divide by 5 = 78.8
The second value of the series will be calculated as: (95 + 93 + 78 +30 + 101) / 5 = 79.4
The third value of the series will be: (93 + 78 + 30 + 101 + 94) / 5 = 79.2
The moving average could either move:
- Up (if the line is moving upward)
- Down
- Sideways (the price is in a range)
If the price is above a moving average, the trend is considered to be going up, hence an uptrend. If it goes down, it is called a downtrend. A downtrend could mean more lows than highs. However, you can find a higher-than-average high in a downtrend, which the lows will drown.

Types of Moving Averages
Fast-moving averages, also called smaller-moving averages, have shorter durations. This means that they have less lag. They are also called short-term or short look-back periods. These averages respond faster to trends than slower-moving averages, called long-term or long look-back periods.
The most common moving averages are the following:
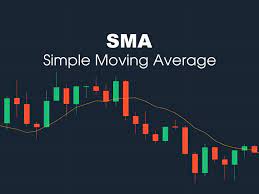
Simple Moving Average (SMA)

These averages generally apply similar weights to all data points. Our example above is an example of a simple moving average in action. It is the simplest in methodology and the most popular, surprising or not. However, most analysts find SMA too simple to be accurate.
SMA = Sum of all data points in the selected moving average period/number of timestamps/periods
Exponential Moving Average (EMA).
These averages will apply more weight to more recent data points. It weights exponentially and includes in its calculation all the data.

Weighted Moving Average (WMA):
Similar to exponential moving averages, emphasis is placed on recent data points. The difference is between exponential and linear increments. Each element in the period will have a weight that is increasing linearly.
It responds to changes faster than a simple moving average but slower to react to changes than an exponential moving average.
Triangular Moving Average (TMA): They apply more weight to middle data, just like a triangle’s shape looks. This means that data is averaged twice. You will need to calculate the SMA first, then find the average of several SMAs divided by the number of timestamps you used.
Due to this double averaging, the lag is more significant. TMA also reacts slower to price fluctuations.
Variable Moving Average (VMA): Depending on how volatile the prices are, this moving average will change weight. Tushar Chande created the Variable Moving Average in 1991. A Volatility Index (VI) alters the moving average when market conditions change.
A moving average as support or resistance
Moving averages are dynamic; they constantly change. Since they are affected by how prices fluctuate, they will change periodically, unlike traditional horizontal support and resistance lines. Support and resistance occur when supply and demand meet. If these levels are broken, new ones are established due to movements.
Support is where demand is strong enough to block a stock’s decline further. Resistance is the level where supply is strong enough to stop a stock from moving higher. The moving average will act as the floor, that is, the support, or as the ceiling, that is, the resistance. Prices will bounce up from off the floor and drop once they hit the ceiling.
Triple Moving Average Crossover Strategy
This strategy involves using three different moving averages from different periods (look-back periods) to create buy and sell signals. It will detect false trading signals better and quicker than other strategies, such as the dual moving average crossover system.
Think of it as having three items to obtain an average compared to having two. Three will provide assurance and stability; that the prices have actually shifted and it’s not a hoax. Generally, it reduces the probability of risk.
You will be able to have a buy signal created very early when a trend is developing, and a sell signal will be generated soon when a trend wears down.
Applying two moving averages
When this happens, especially if one is longer and the other is shorter, buy or sell signals are created. If the moving average with the shorter term crosses above the other one, this is considered a buy signal. This means that the trend is changing upwards and is called a golden cross.
The vice versa holds and is considered a sell signal. This downtrend is known as a dead cross or death cross.


